

Overview
As a network engineer, I often find myself working with CSV files on a daily basis. For example, if you export traffic logs from Palo Alto or Check Point firewall, you will get a CSV file. You might also use a CSV file to store a variety of configuration items such as interface name, description, IP address etc.
To work with CSV files in a network automation context, you can use a variety of tools and programming languages. Python is a popular choice, as it provides libraries for reading and writing CSV files and for processing the data they contain. Other options include using a spreadsheet program like Microsoft Excel or Google Sheets to edit and manipulate the data in the CSV file.
If you have just a few hundred rows and a few columns then it is very straightforward to open and edit them using Excel or Google sheets. But imagine you have thousands of rows and hundreds of columns, how can you manipulate a large set of data with very little effort?
This is where 'pandas' comes in to simplify the task of manipulating the data. I don't have a lot of in-depth knowledge of pandas, but I know enough to have a general understanding and use it with network automation tasks.
pandas is a fast, powerful, flexible and easy to use open source data analysis and manipulation tool, built on top of the Python programming language.
Installation and Import
Install pandas
Installing pandas is very straightforward, just install it with the pip command as shown below.
pip install pandasStart using pandas
To start working with pandas, import the pandas package as shown below. When importing pandas, you can use the most common alias pd. By using an alias, you can just type pd instead of pandas throughout your python script.
import pandas as pdUse pandas to analyse traffic logs
As part of my job, I often work with traffic logs from various firewalls. Consider yourself lucky if you have tools like Splunk which can index the data and provide the desired output with very little effort. You can also find some other tools that can give you what you want but my tool of choice is always Python.
The ultimate goal of this post is to download the traffic logs from the Palo Alto firewall and use Pandas to clean it up so, we will have a very small file to work with instead of having a massive file.
Palo Alto traffic logs
When you export traffic logs from the Palo Alto firewall, you can choose to download the logs as a CSV file. I prefer not to add too many filters on the firewall when importing the logs. For example, let's say I want to analyse all the traffic logs from a particular subnet for a number of days, my typical workflow is to add just two filters, the time interval and the subnet. For example, if the subnet in question is 10.10.0.0/16 then the filter would look like the following.
( receive_time leq '2022/12/25 01:00:00' ) and ( receive_time geq '2022/12/24 01:00:00' ) and ( addr.src in 10.10.0.0/16 )Depending on your environment, you might end up with a very large file. If the file exceeds 500 MB, excel will have a very hard time opening and processing the file. For example, as soon as I opened the file (700 MB), excel froze and threw this error.


1. Remove Unnecessary Columns
As depicted in the above figure, the file is too large for Excel to process it. I'm not saying Excel can't handle large file, it's just my laptop is not powerful enough. The downloaded file contains so much unnecessary data for my use case, such as domain, serial, category of app, host ID, type etc. I'm only interested in source IP, destination IP, port, protocol and action.
The first step is to remove the columns that we are not interested in. Let's import this file into Pandas and start working on it. The below figure shows you the truncated version of the CSV file.
import pandas as pd
df = pd.read_csv('palo_alto_logs.csv')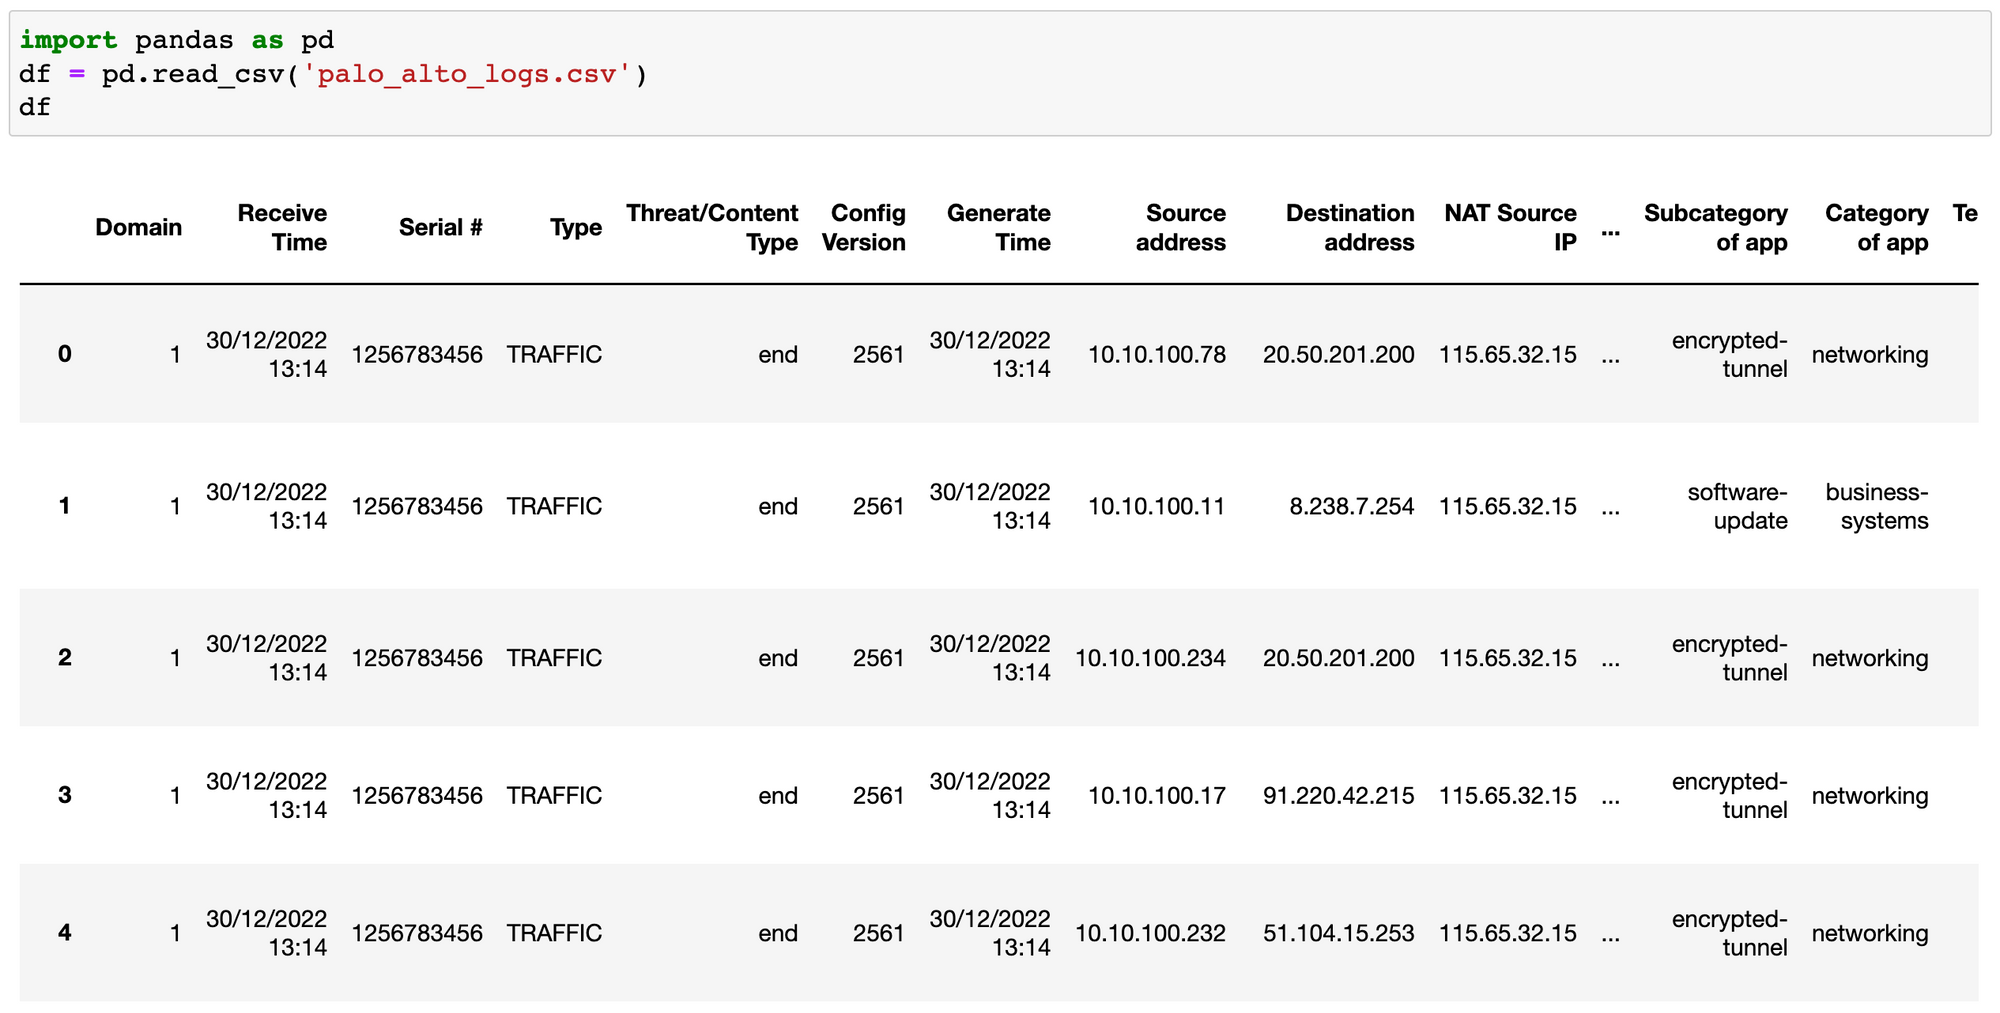
Now that we have imported the file, let's remove all the unnecessary columns. We can either 'remove specific columns' or 'remove all the columns except a few. For our use case, let's use the latter as we only want to keep very few columns so, it doesn't make sense to type all the columns that we don't need.
By default, the log file comes with almost a hundred columns as shown below.
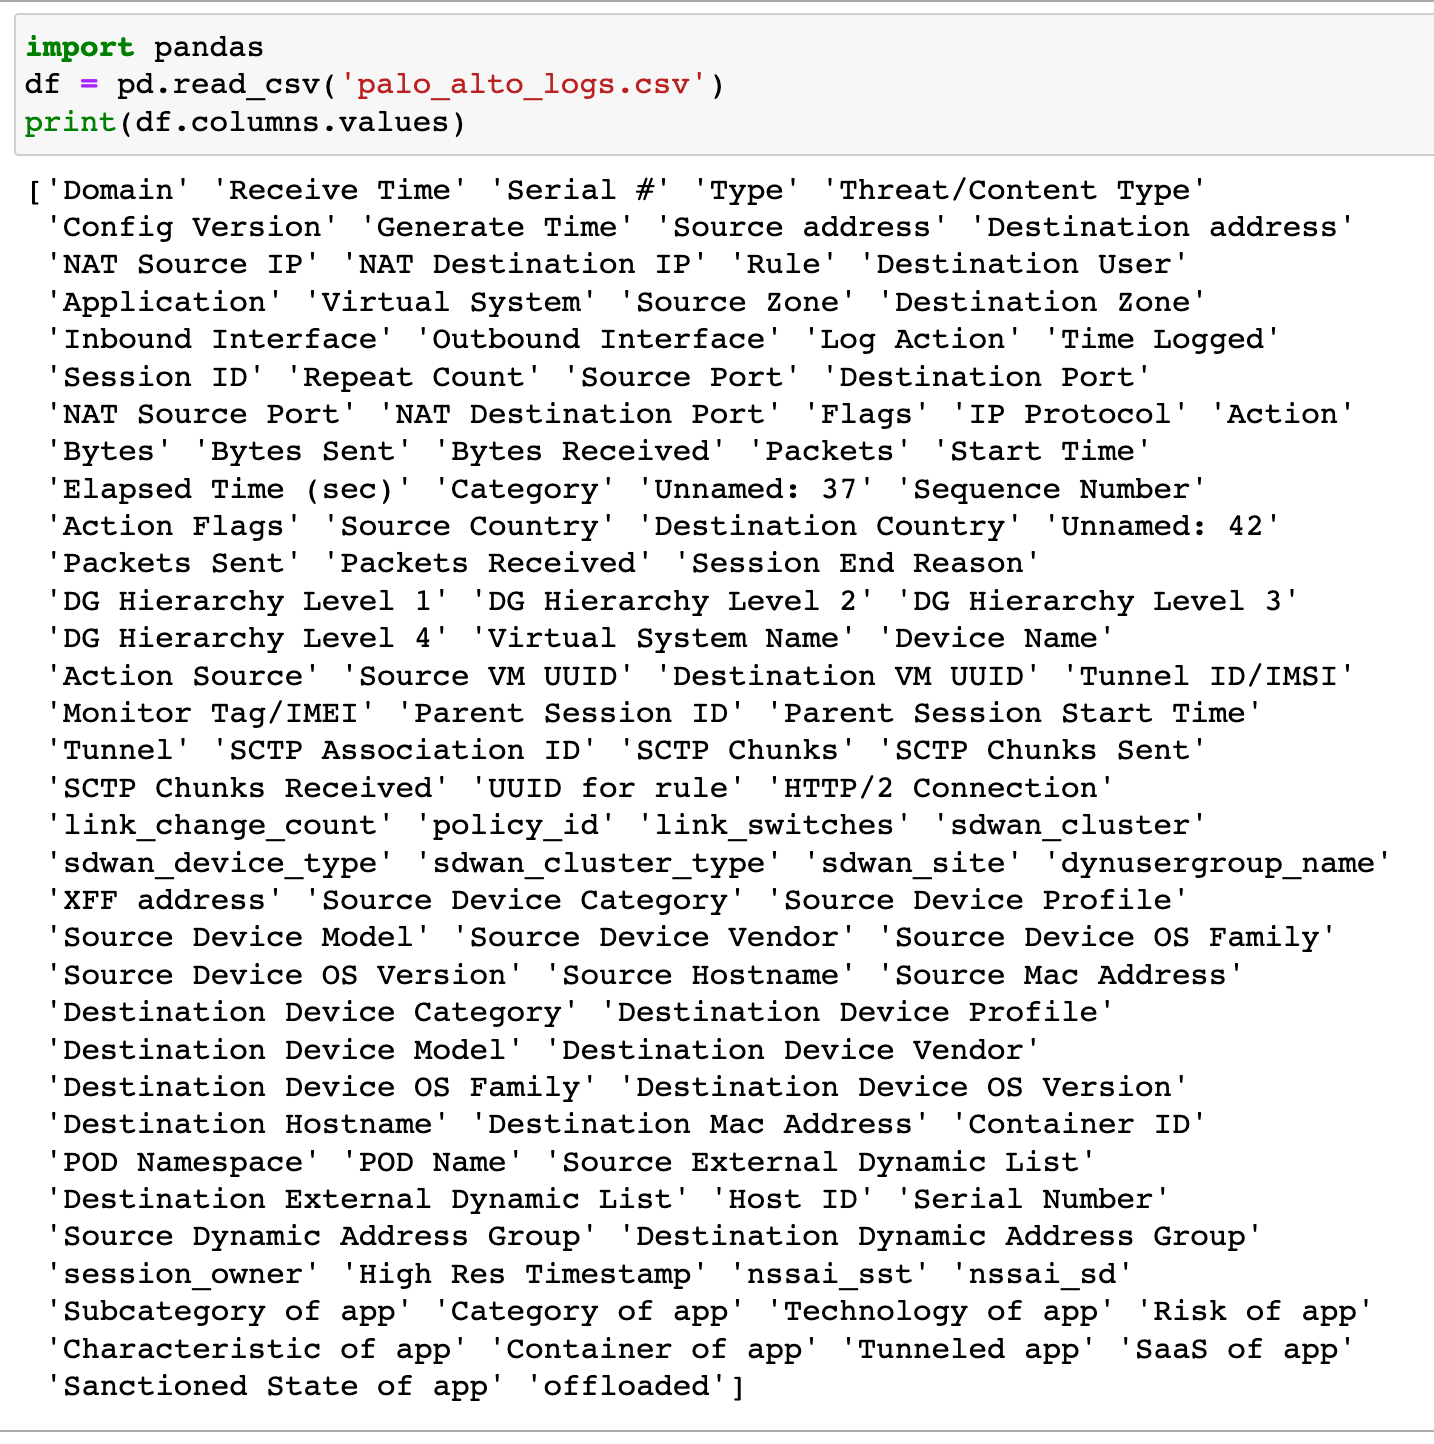
Most of the information shown to us is useless to the context of the work.
I'm going to export the new data with just the specific columns to a new CSV file called palo_alto_logs_shorter.csv
import pandas as pd
df = pd.read_csv('palo_alto_logs.csv')

df = df[['Receive Time', 'Source address', 'Destination address', 'Application', 'Destination Port', 'IP Protocol', 'Action']]
df.to_csv('palo_alto_logs_shorter.csv', index=False)
The new file looks much better now. By removing the unnecessary columns, we went from a 770 MB file to a 70 MB file.
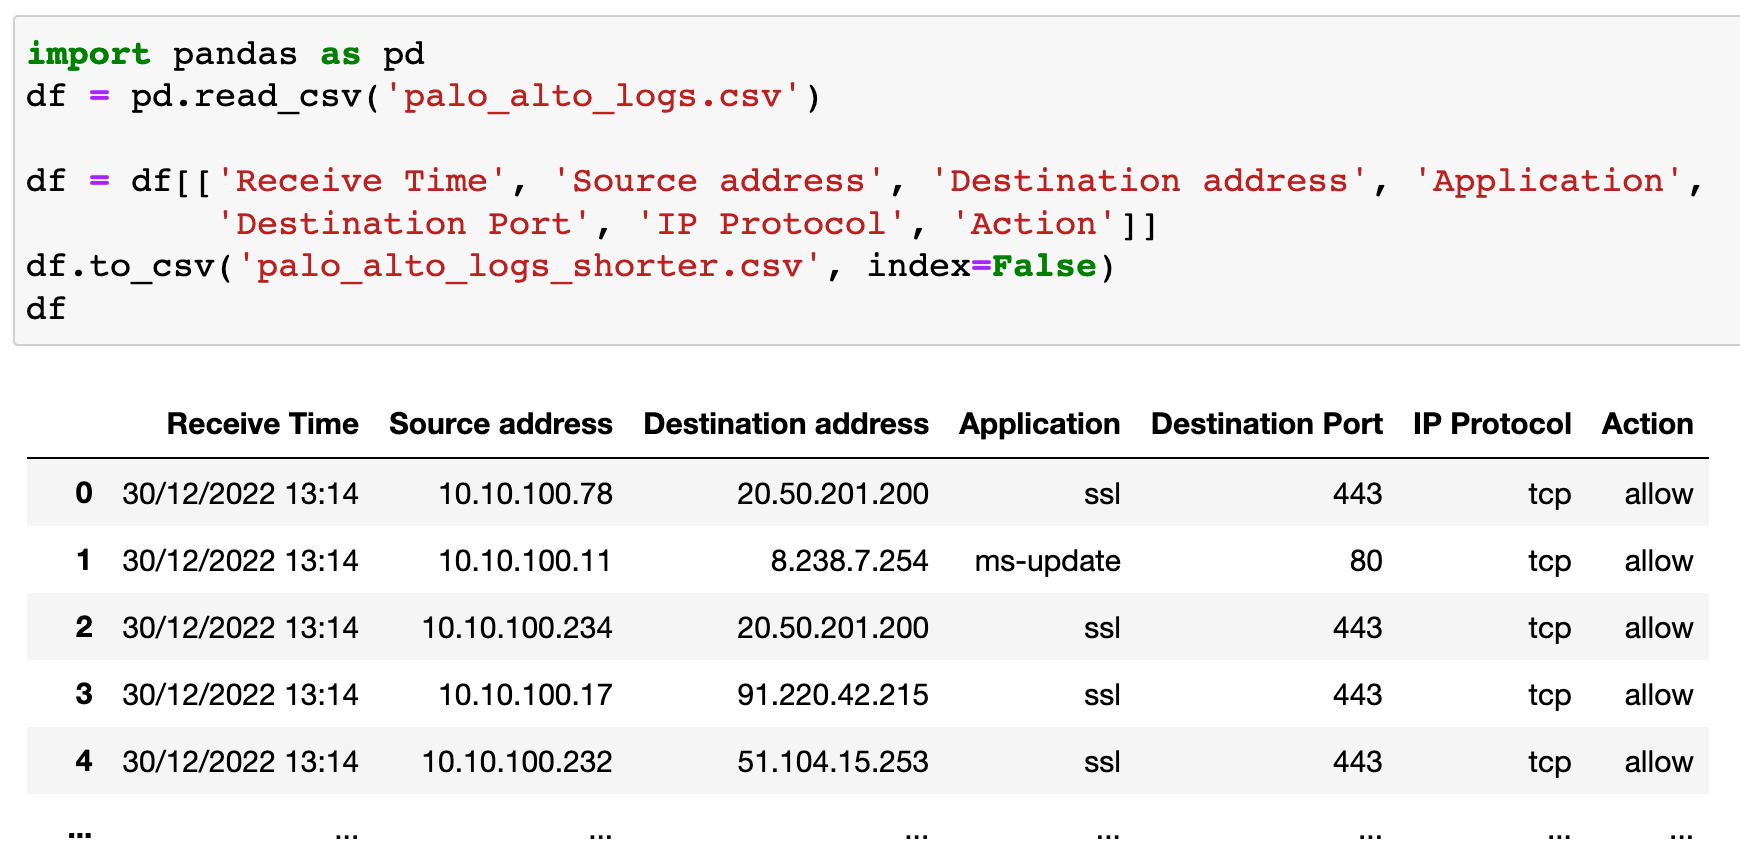
index=False2. Remove duplicates
The next step of my workflow is to remove all the duplicate entries because I'm only after unique traffic entries.
Just to show you an example, there are two visible entries (duplicate entries) for the connectivity between 10.10.100.17 and 20.50.201.200. If you scroll through the entire file, you will find a lot more duplicate entries.
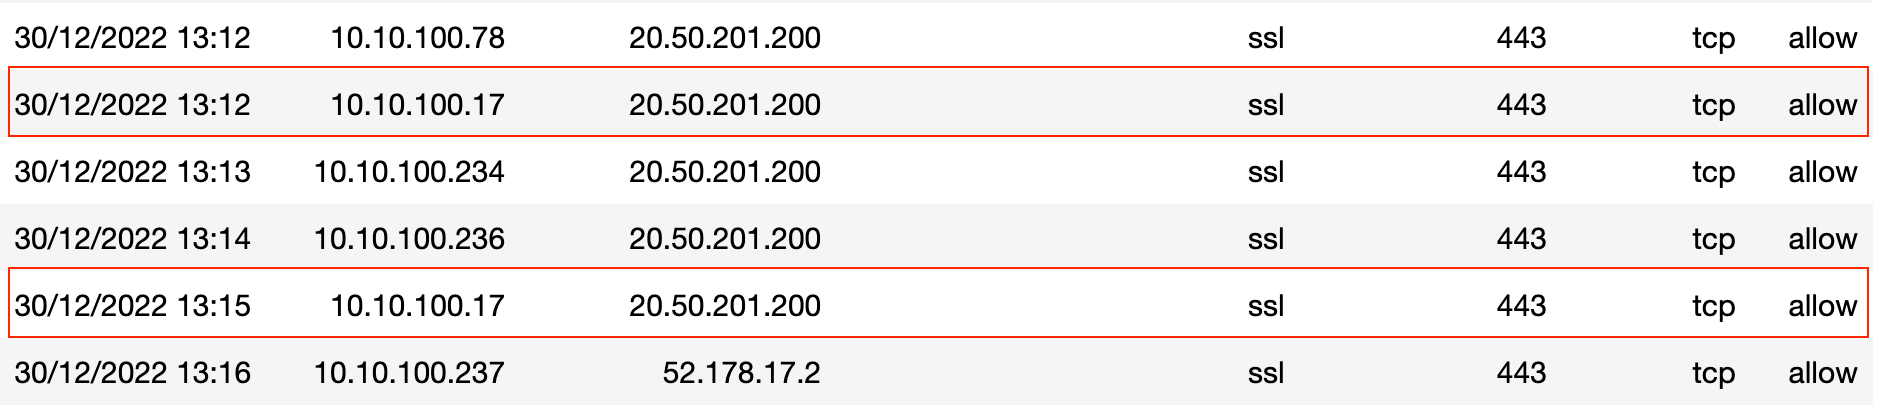
You can use the pandas dataframe.drop_duplicates() method to drop the duplicate entries. We also need to tell pandas to ignore the 'Receive Time' column when checking for duplicates as the 'time-stamps' will always be different for each entry.
import pandas as pd

df = pd.read_csv('palo_alto_logs_shorter.csv')
df.drop_duplicates(subset=df.columns.difference(['Receive Time']), inplace=True)

df.to_csv('palo_alto_logs_without_duplicates.csv', index=False)
The above script will remove all the duplicates from the DataFrame and export it to a new file called palo_alto_logs_without_duplicates.csv
We went from having over one million rows to just forty thousand rows.
import pandas
df = pd.read_csv('palo_alto_logs.csv')
print(f"Number of rows initially - {len(df.index)}")

df = df[['Receive Time', 'Source address', 'Destination address', 'Application',
         'Destination Port', 'IP Protocol', 'Action']]

df.drop_duplicates(subset=df.columns.difference(['Receive Time']), inplace=True)
print(f"Number of rows after removing columns and duplicates - {len(df.index)}")

#output
Number of rows initially - 1048576
Number of rows after removing columns and duplicates - 44179inplace=True does, please check out the detailed explanation here - https://towardsdatascience.com/why-you-should-probably-never-use-pandas-inplace-true-9f9f211849e43. Find 'denied' traffic
Next, let's look at an example of how to find the traffic entries that were denied by the firewall. The three lines of code shown below will just do that.
import pandas
df = pd.read_csv('palo_alto_logs_shorter.csv')
df[(df['Action'] == 'deny')]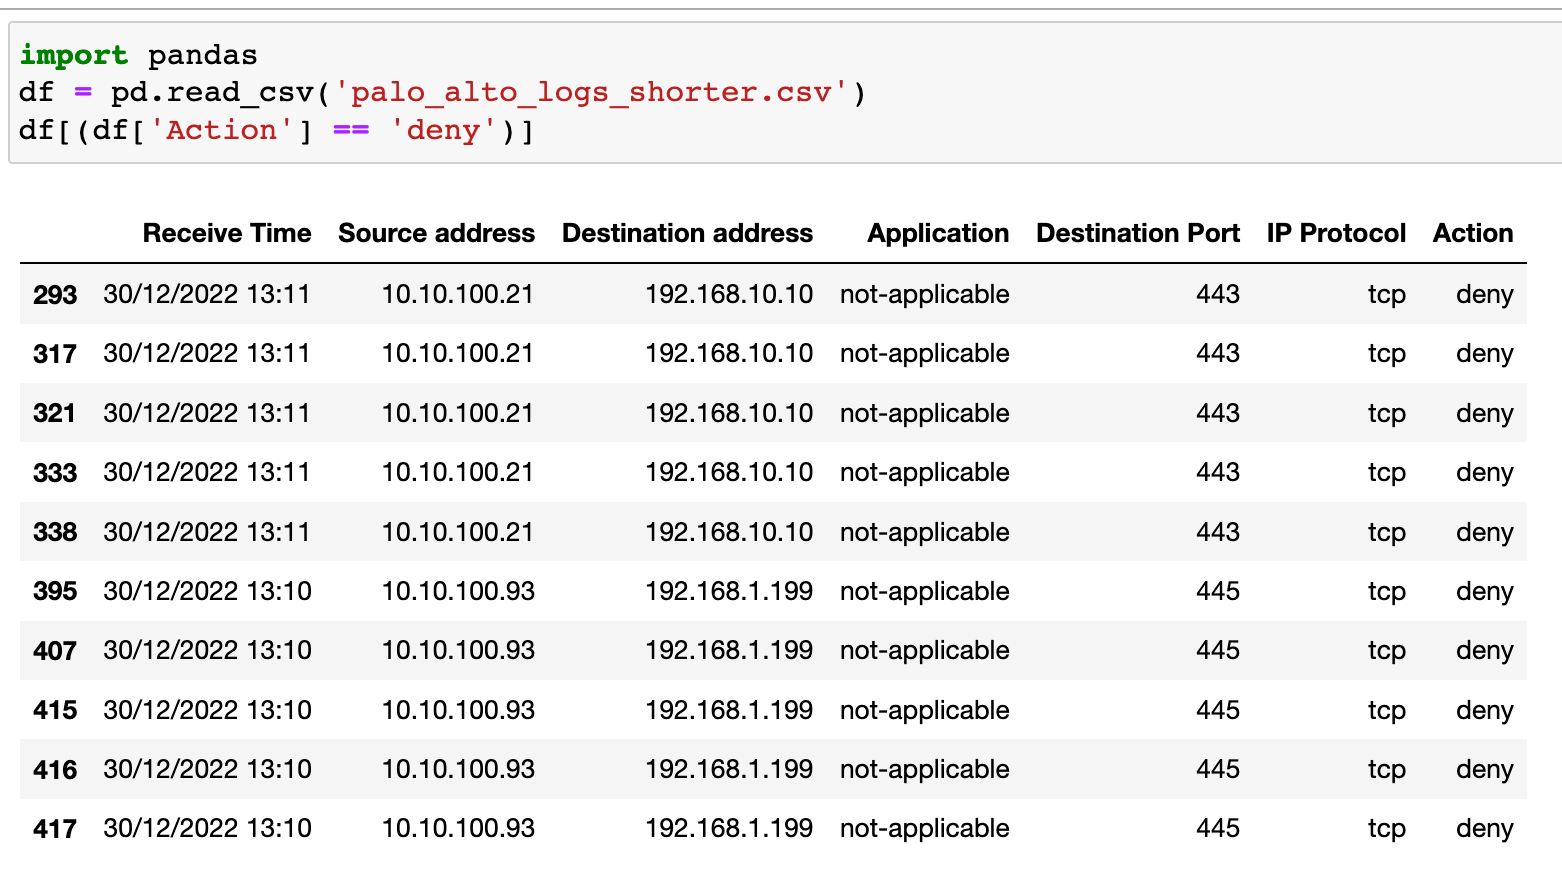
4. Count by column name
You can use pandas DataFrame.groupby().count() method to group columns and count the occurrences. Let's look at an example of grouping the rows by column and use the count() method to get the count for each application.
import pandas as pd

df = pd.read_csv('palo_alto_logs_shorter.csv')
df = df.groupby('Application')['Application'].count()
df.sort_values()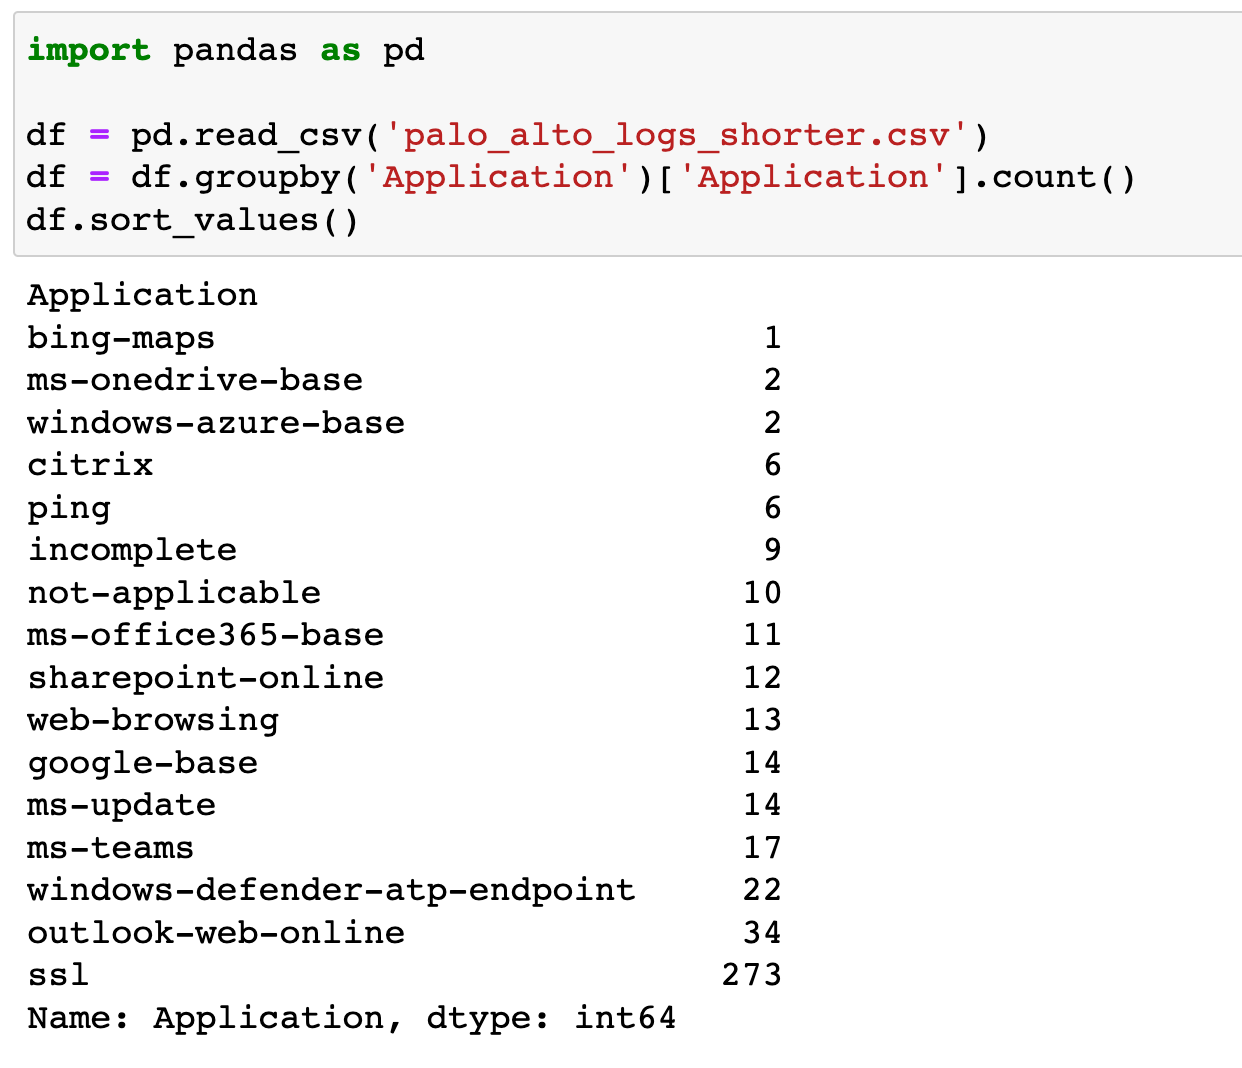
Please note that you can also use the value_count() method if you are grouping the data using a single column. The end result is exactly the same.
import pandas as pd

df = pd.read_csv('palo_alto_logs_shorter.csv')
df['Application'].value_counts()
More tips and tricks
The following examples are based on the below CSV file obtained from https://people.sc.fsu.edu/~jburkardt/data/csv/csv.html
| Month | 1958 | 1959 | 1960 |
|---|---|---|---|
| JAN | 340 | 360 | 417 |
| FEB | 318 | 342 | 391 |
| MAR | 362 | 406 | 419 |
| APR | 348 | 396 | 461 |
| MAY | 363 | 420 | 472 |
| JUN | 435 | 472 | 535 |
| JUL | 491 | 548 | 622 |
| AUG | 505 | 559 | 606 |
| SEP | 404 | 463 | 508 |
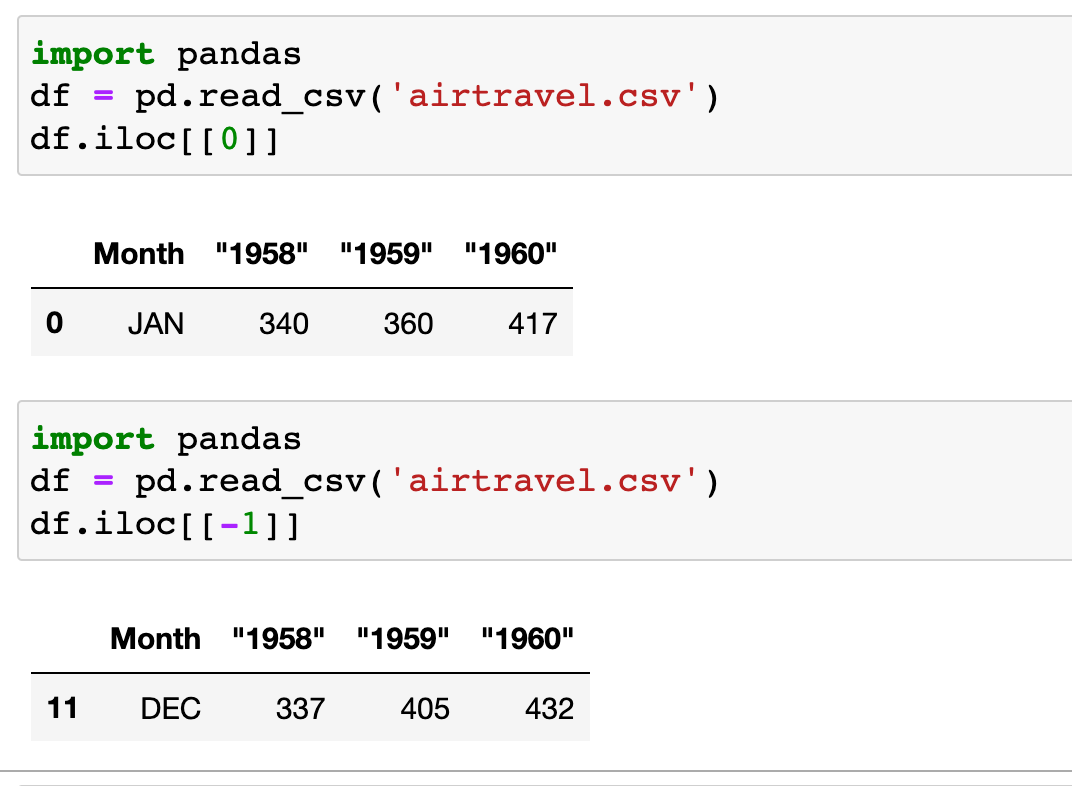
1. Read a specific row
You can use the Dataframe.iloc[] method to retrieve specific rows from a DataFrame. Let's look at an example to extract the first and last rows of data. You can call the method and specify the index of the row, 0 for the first one or -1 for the last one.
2. Count the number of rows
import pandas
df = pd.read_csv('airtravel.csv')
print(len(df))

#output
12
3. Insert Header Row
Just to demonstrate, I'm going to remove the headers from the file and show you how you can easily add a header row that includes the titles of each column. I've made a slight change to the column titles so, you can see the difference. (I've appended the letter 'y' in front of the year)
import pandas
df = pd.read_csv('airtravel.csv')
df.columns = ['Month','Y-1958', 'Y-1959', 'Y-1960']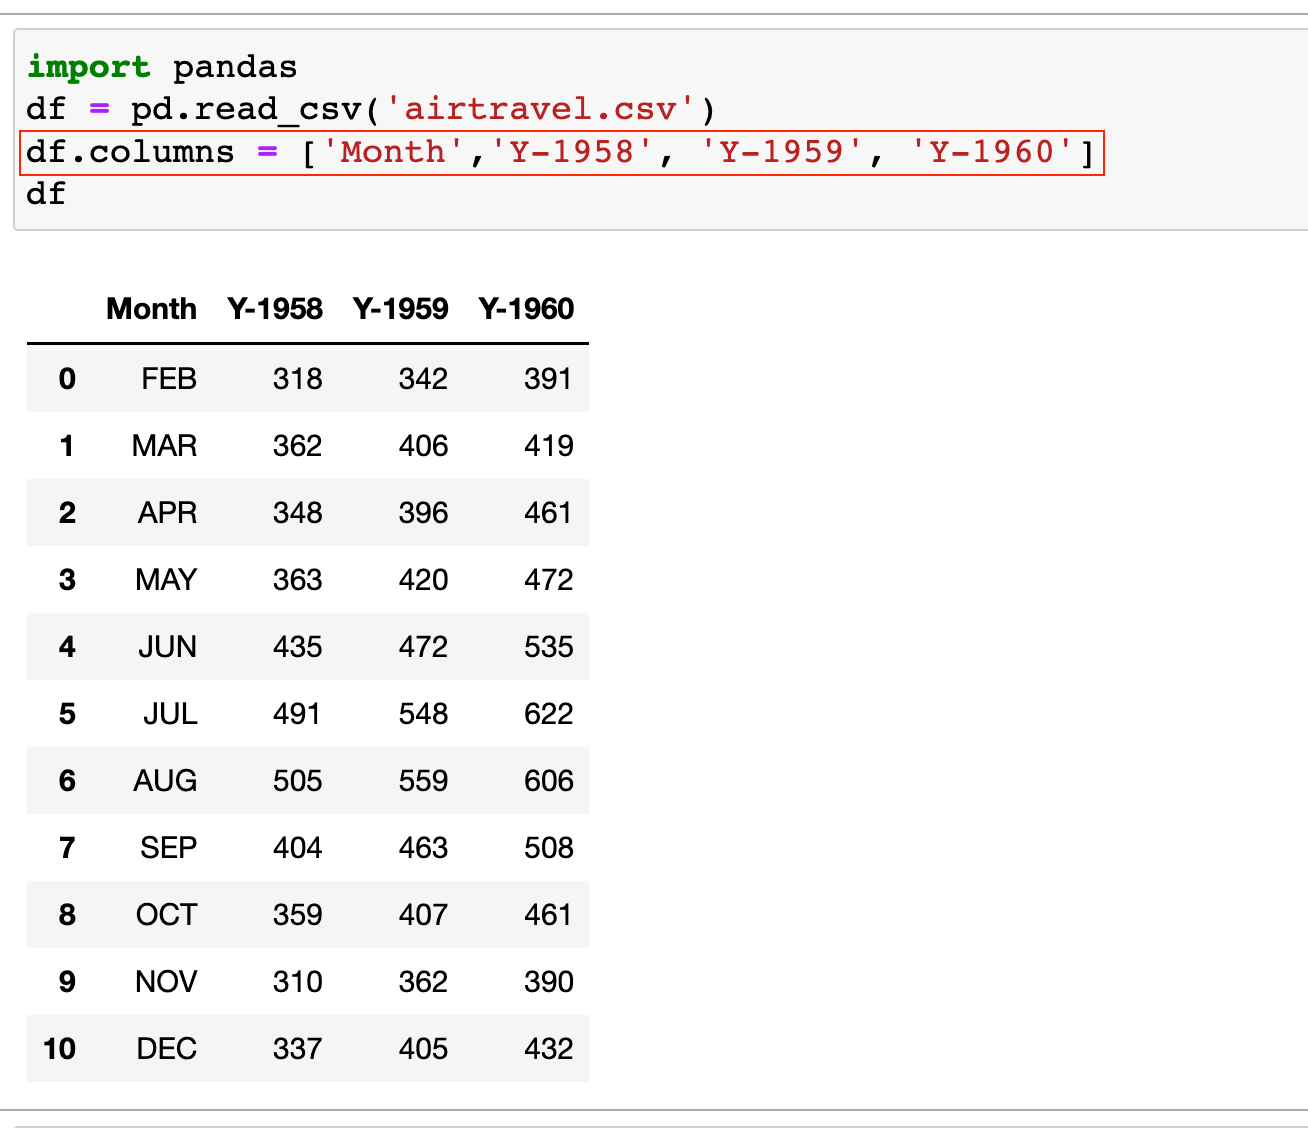
Closing up
Pandas is such an amazing tool for manipulating data specifically CSV files. This example is just a drop in the ocean. I will try to cover more examples in the upcoming posts.
If you have any thoughts or questions about the topic, please feel free to leave a comment or send me a message. I would love to continue the discussion and hear your perspective. Again, thank you for taking the time to read my post and for supporting my writing.