If you follow my blog, you probably know that I’m a big advocate for using Containerlab and Netlab to spin up network labs. I’ve already covered both tools in detail, so I won’t go over the basics again here. You can check the links below if you’re new to them or want a quick refresher. In this post, we’ll look at how to take packet captures in Containerlab labs. So, let’s get started.

How do I run Containerlab?
I know everyone has their own way of running Containerlab, so I thought I’d share how I set up and run my labs. My daily driver is a MacBook, but I run Containerlab on a server that’s set up as an Ubuntu VM. I connect to that VM over SSH. Both my MacBook and the VM are on the same subnet, for example 10.10.0.0/24.
For my Containerlab nodes, I usually place them in a management VLAN, such as 192.168.10.0/24. On my MacBook, I add a static route that points to the VM’s IP address so I can reach the node IPs directly.
You can take packet captures in Containerlab in a few different ways. The most common options are using tcpdump directly, using Edgeshark for a web-based capture, or using the VS Code Containerlab extension.
Tcpdump
Using tcpdump is by far the simplest option. I already have a lab running, and let’s say I want to look at the packets on a specific node and interface. You can start by running docker ps on the host where Containerlab is running to get the container name for the node you’re interested in. Once you have the name, decide which interface you want to capture traffic on.
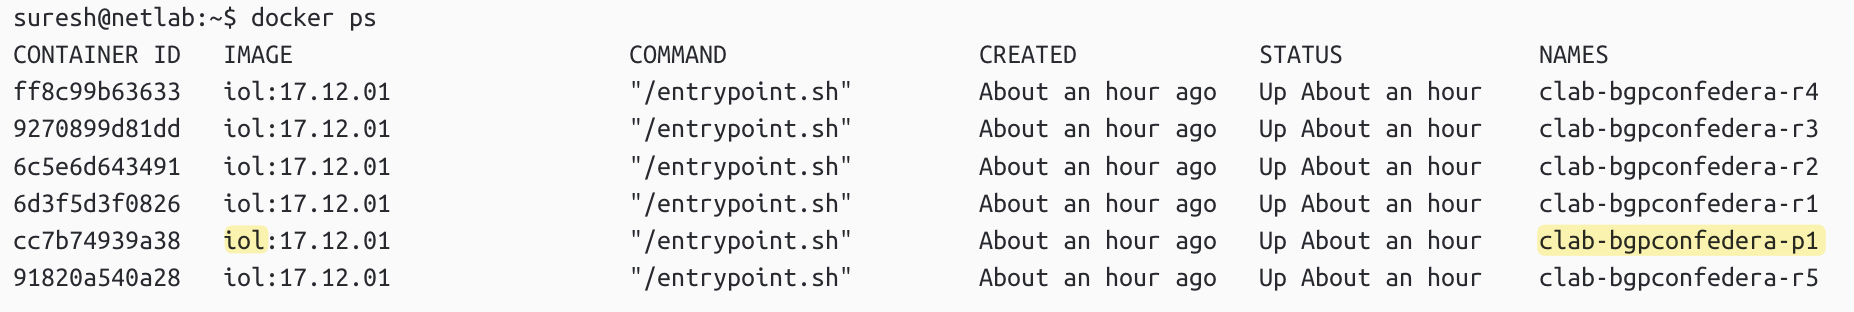
In my case, I’m using a Cisco IOL node (clab-bgpconfedera-p1), and I want to capture packets on the Ethernet0/2 interface, which maps to eth2 inside the container.
p1#show ip interface brief | excl down
Interface IP-Address OK? Method Status Protocol
Ethernet0/0 192.168.200.111 YES TFTP up up
Ethernet0/1 100.10.10.11 YES manual up up
Ethernet0/2 172.16.1.1 YES manual up up
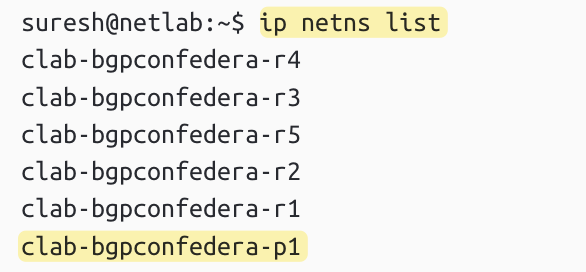
Loopback0 10.0.0.11 YES manual up upThe command sudo ip netns exec clab-bgpconfedera-p1 tcpdump -nni eth2 runs a packet capture inside the network namespace of a specific container. In this case, clab-bgpconfedera-p1 is the name of the container (also the name of the namespace) where we want to capture the traffic.
suresh@netlab:~$ sudo ip netns exec clab-bgpconfedera-p1 tcpdump -nni eth2
[sudo] password for suresh:
tcpdump: verbose output suppressed, use -v[v]... for full protocol decode
listening on eth2, link-type EN10MB (Ethernet), snapshot length 262144 bytes
11:59:24.519713 IP 172.16.1.1.65174 > 172.16.1.2.179: Flags [P.], seq 450574696:450574715, ack 93925104, win 16213, length 19: BGP
11:59:24.639532 IP 172.16.1.2.179 > 172.16.1.1.65174: Flags [.], ack 19, win 16194, length 0
11:59:26.044426 IP 172.16.1.1 > 172.16.1.2: ICMP echo request, id 1, seq 0, length 80
11:59:26.044830 IP 172.16.1.2 > 172.16.1.1: ICMP echo reply, id 1, seq 0, length 80
11:59:26.045211 IP 172.16.1.1 > 172.16.1.2: ICMP echo request, id 1, seq 1, length 80
11:59:26.045487 IP 172.16.1.2 > 172.16.1.1: ICMP echo reply, id 1, seq 1, length 80
11:59:26.045811 IP 172.16.1.1 > 172.16.1.2: ICMP echo request, id 1, seq 2, length 80
11:59:26.046157 IP 172.16.1.2 > 172.16.1.1: ICMP echo reply, id 1, seq 2, length 80
11:59:26.046500 IP 172.16.1.1 > 172.16.1.2: ICMP echo request, id 1, seq 3, length 80
11:59:26.046719 IP 172.16.1.2 > 172.16.1.1: ICMP echo reply, id 1, seq 3, length 80
11:59:26.047012 IP 172.16.1.1 > 172.16.1.2: ICMP echo request, id 1, seq 4, length 80
11:59:26.047305 IP 172.16.1.2 > 172.16.1.1: ICMP echo reply, id 1, seq 4, length 80
The ip netns exec part lets you run a command inside a specific network namespace. Each container in Containerlab runs in its own namespace, which means it has its own interfaces, routing table, and network stack. By using ip netns exec, you’re basically entering that container’s network space. Once inside, the tcpdump -nni eth2 command captures packets on the eth2 interface, which in this case maps to the Ethernet0/2 interface of the Cisco IOL node.
This approach is simple for quickly checking what’s happening on a specific link or verifying if packets are being sent or received as expected.
Edgeshark Integration
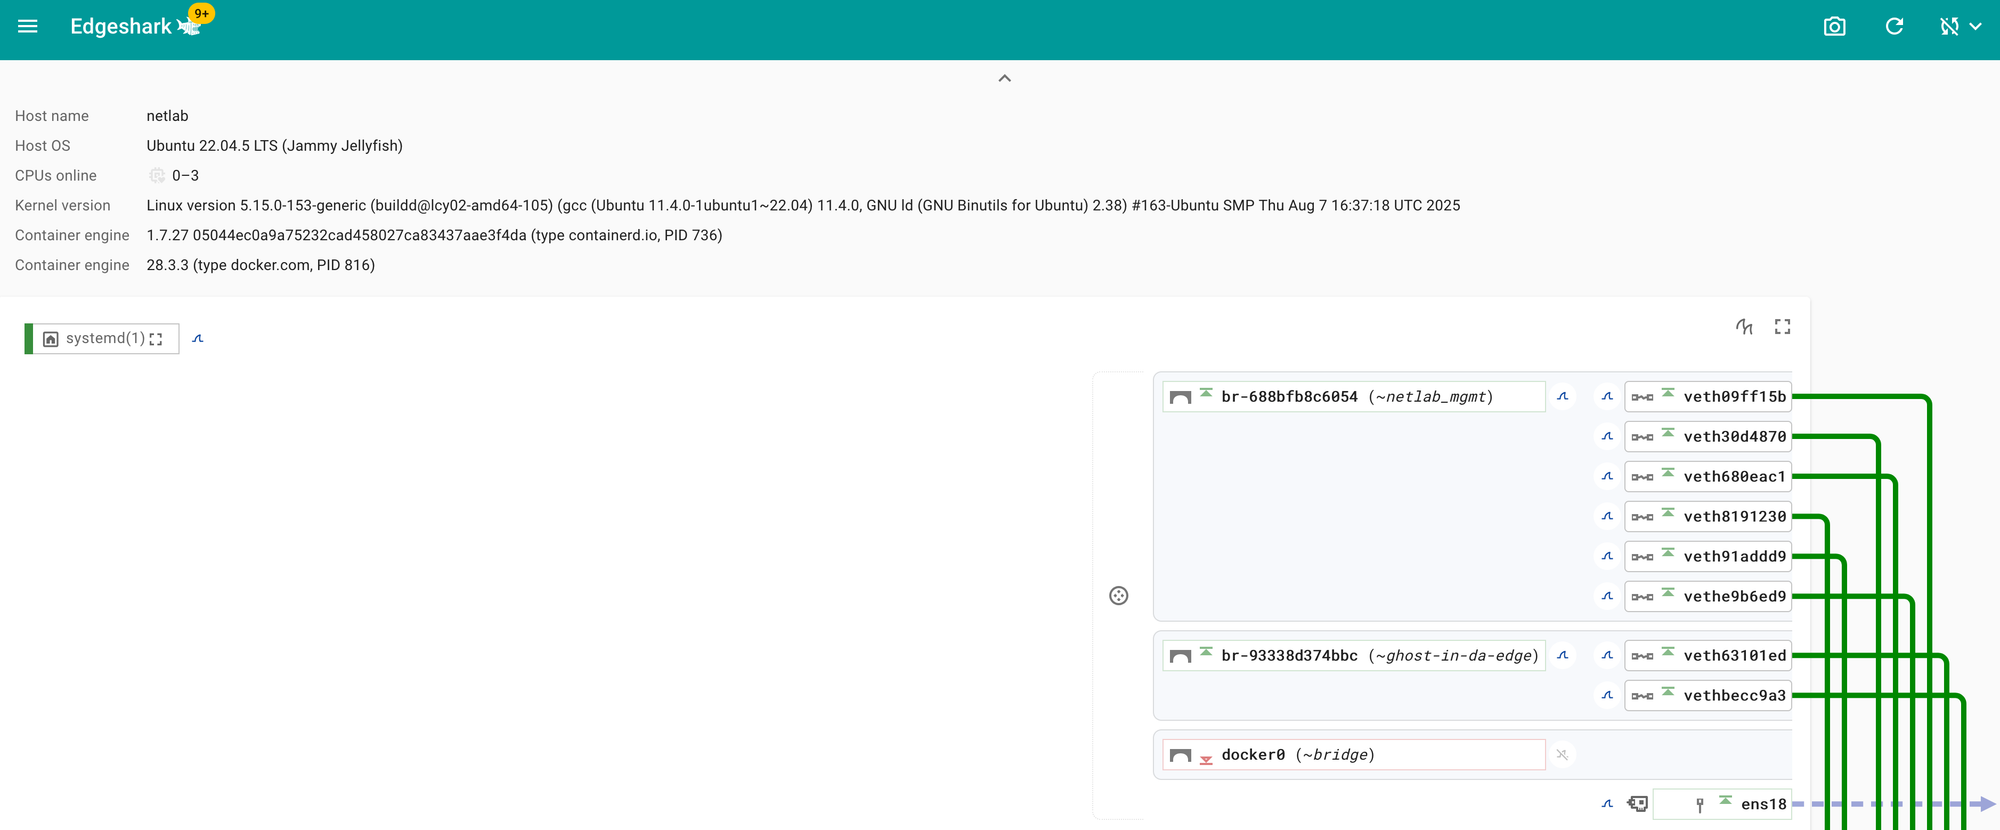
Ideally, you want to view the packets directly in Wireshark and have the ability to save the captures for later analysis. This is where Edgeshark comes in. Edgeshark is a web-based packet capture and analysis tool built by Siemens. It integrates nicely with Containerlab and lets you capture and view traffic from your lab nodes through a simple browser interface, without manually copying PCAP files.
You can install Edgeshark on the same host where Containerlab is running. Containerlab’s documentation covers this setup well, but here’s the quick command to start it
curl -sL \
https://github.com/siemens/edgeshark/raw/main/deployments/wget/docker-compose.yaml \
| DOCKER_DEFAULT_PLATFORM= docker compose -f - up -d
This command deploys the Edgeshark containers and exposes the web interface on port 5001 of the Containerlab host. You can access the webgui via https://<containerlab-host-address>:5001.
To integrate Edgeshark with Wireshark, you need to do two things, set up your system to handle the packetflix:// URL and install the Wireshark capture plugin. You only need to do this once, and it will work for all future captures. The official documentation has a great guide on how to set this up, but I will show you how I did it on my MacBook.
macOS - Step 1
Reference - https://containerlab.dev/manual/wireshark/#edgeshark-integration
Download the zip file with the AppleScript that enables the packetflix:// URL schema handling, unarchive it and move the EdgeShark-handler script to the Applications folder. Here is the script that does all that, run it from your MacOS terminal.
mkdir -p /tmp/pflix-handler && cd /tmp/pflix-handler && \
rm -rf packetflix-handler.zip packetflix-handler.app __MACOSX && \
curl -sLO https://github.com/srl-labs/containerlab/files/14278951/packetflix-handler.zip && \
unzip packetflix-handler.zip && \
sudo mv packetflix-handler.app /Applications
macOS - Step 2
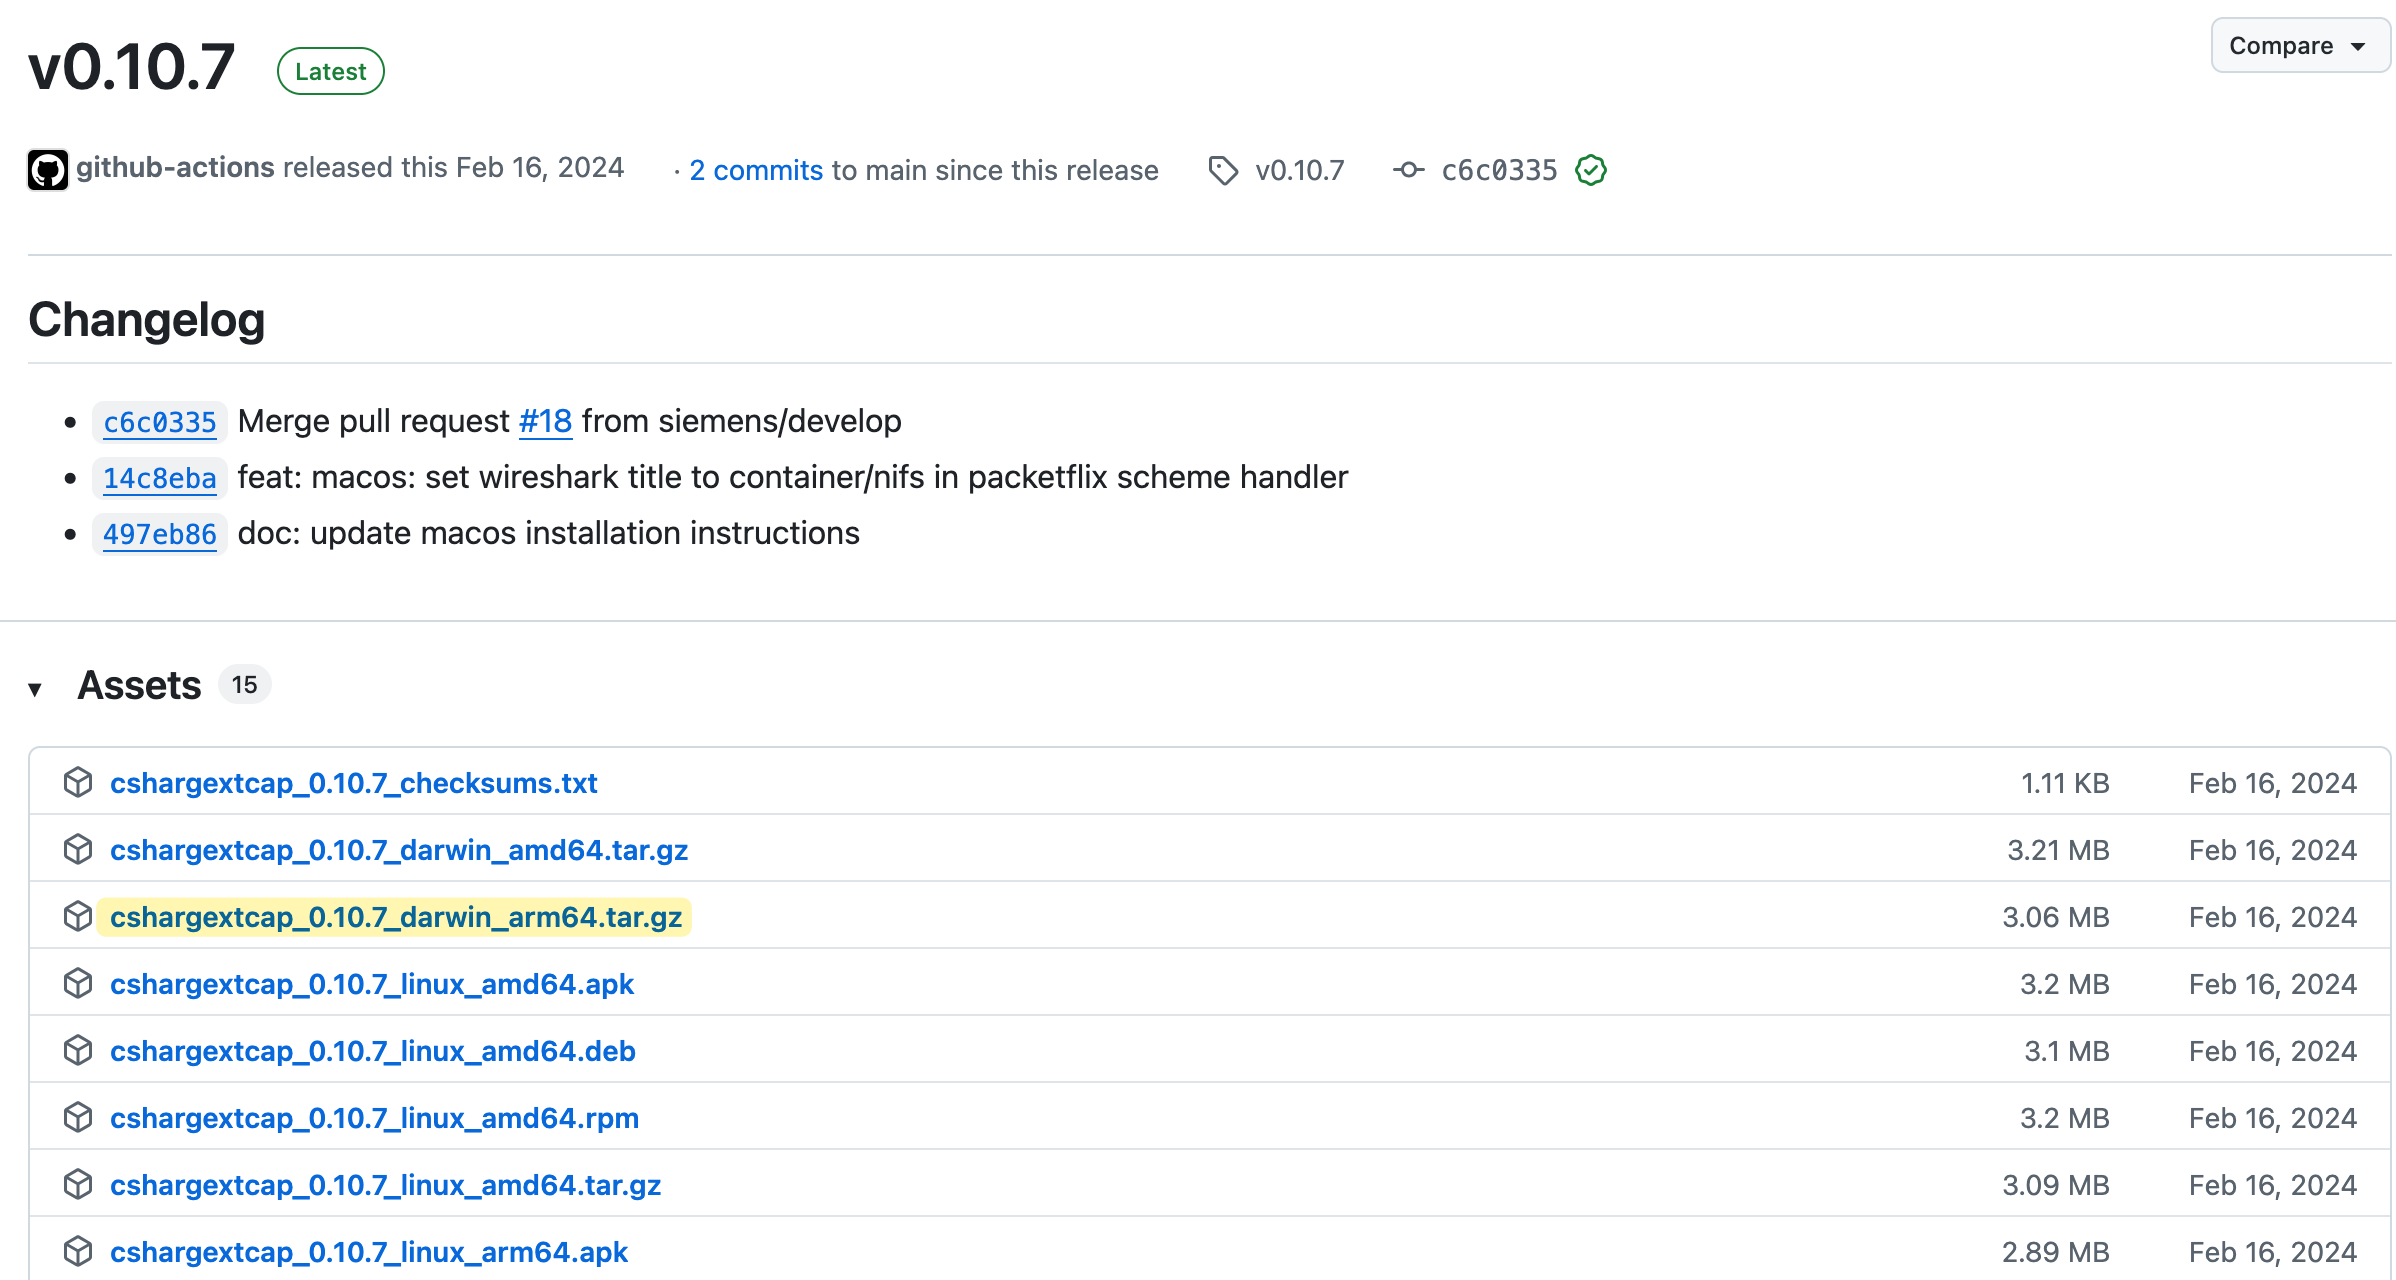
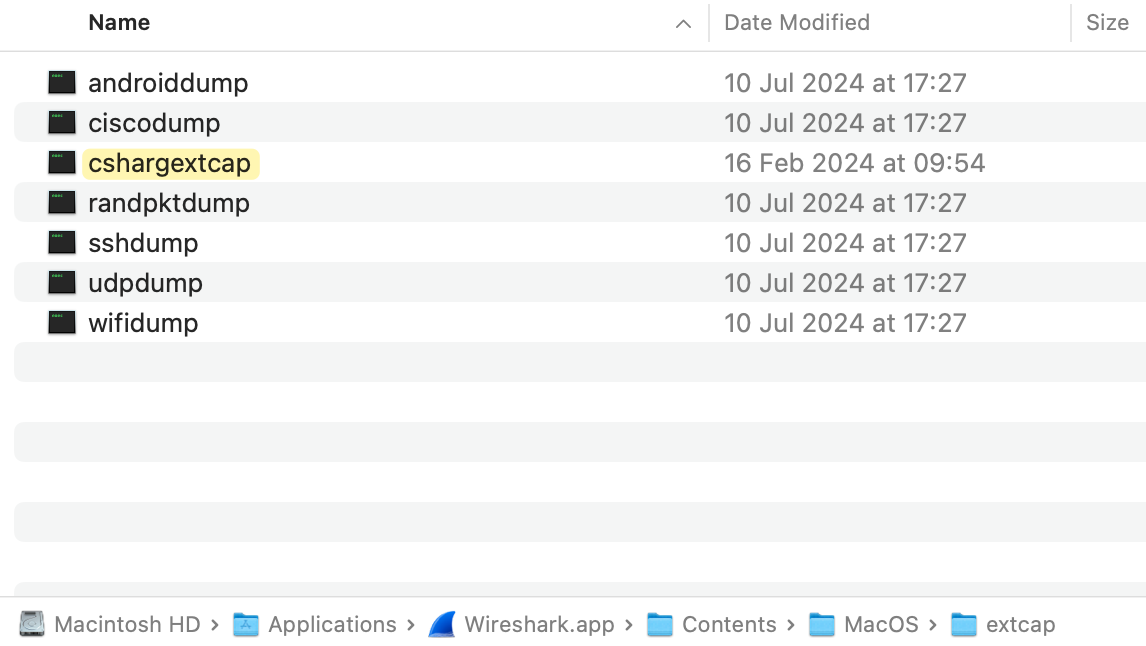
Download the external capture plugin for Darwin OS and your architecture, unarchive and copy it with Finder to the /Applications/Wireshark.app/Contents/MacOS/extcap/ directory.
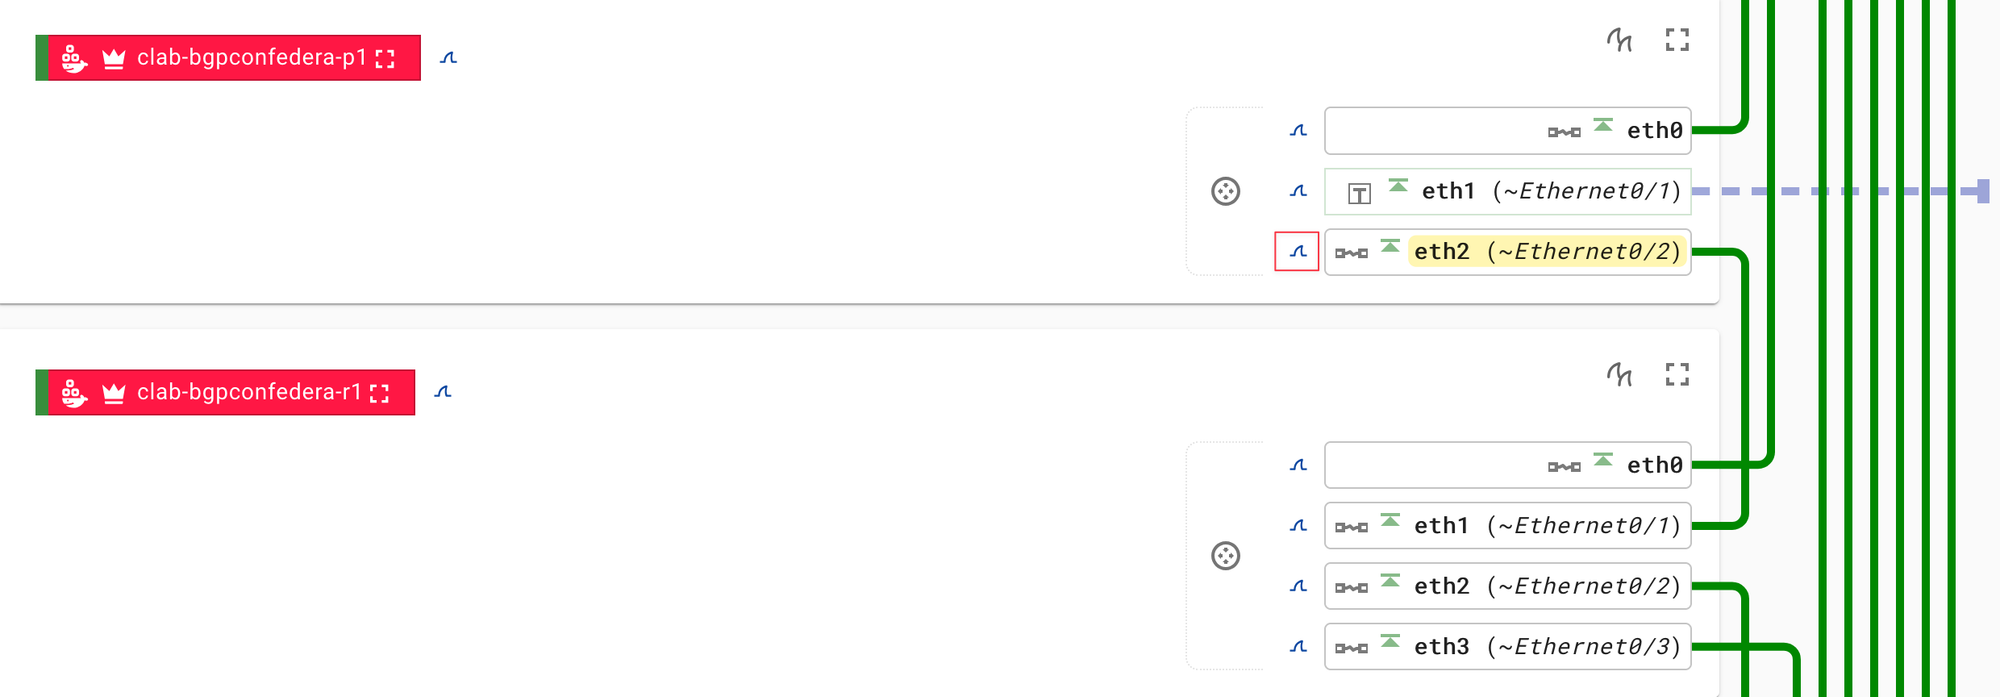
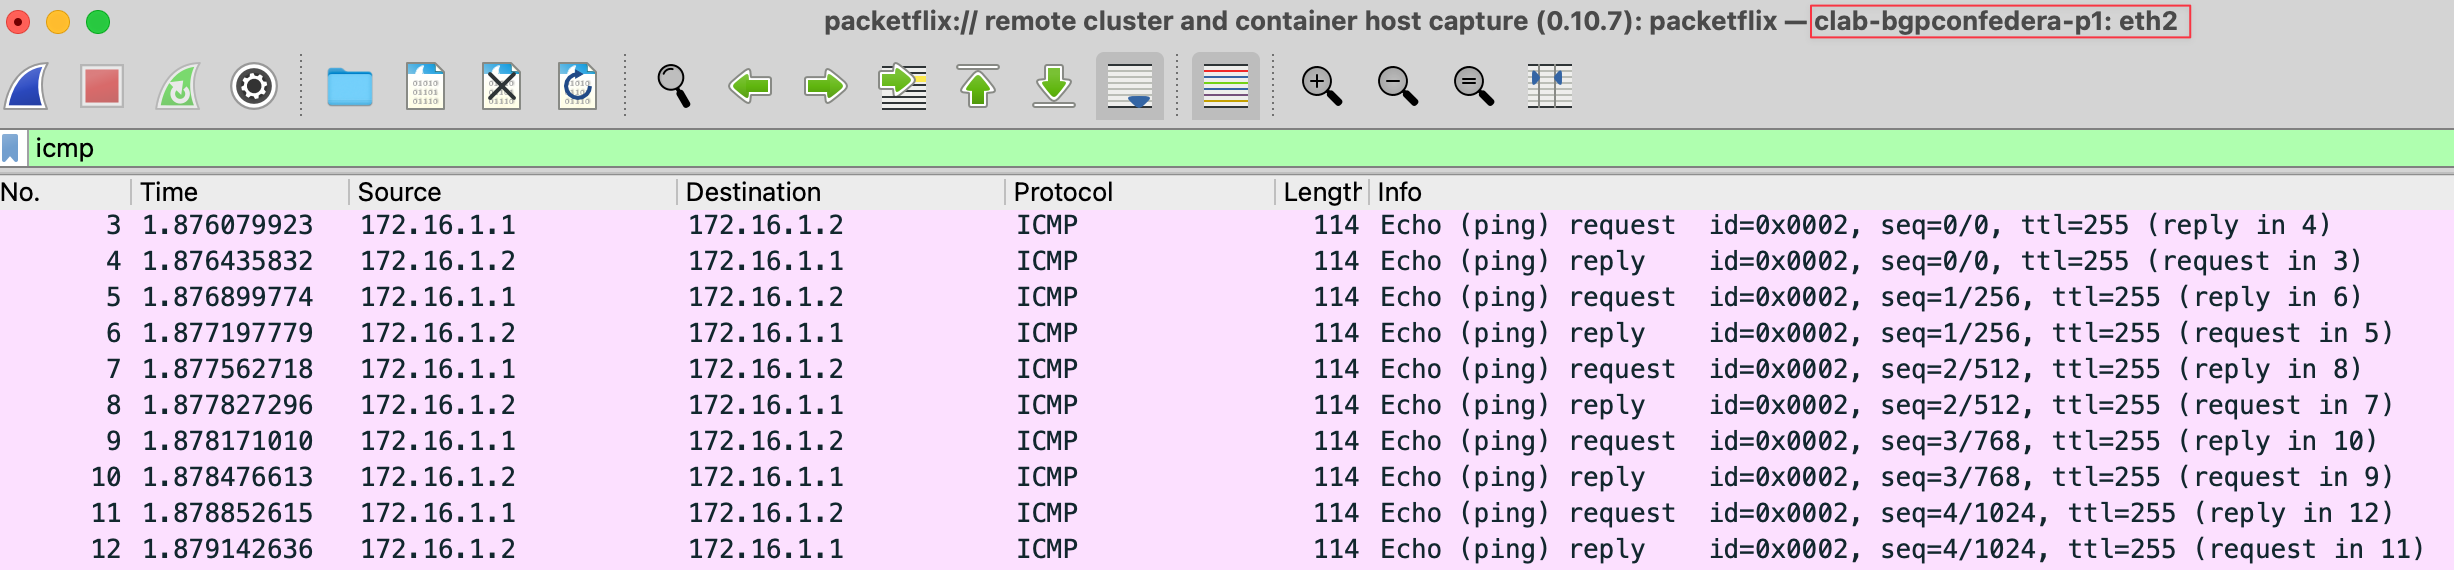
Now that everything is set up, you can open the Edgeshark web interface, find the node and interface you want to capture on, and click the small fin icon next to it. This will automatically open Wireshark on your system and start the capture right away. Pretty neat, right?
Containerlab VS Code Extension
I use the VS Code Remote - SSH extension to connect to the server running Containerlab. This lets me open and edit files directly from my Mac in my local VS Code instance instead of working on the terminal with editors like vim or nano. The Remote SSH extension creates a connection to the remote system and runs a lightweight VS Code server there, so everything feels just like working locally. You can browse files, edit configurations, and run commands easily.
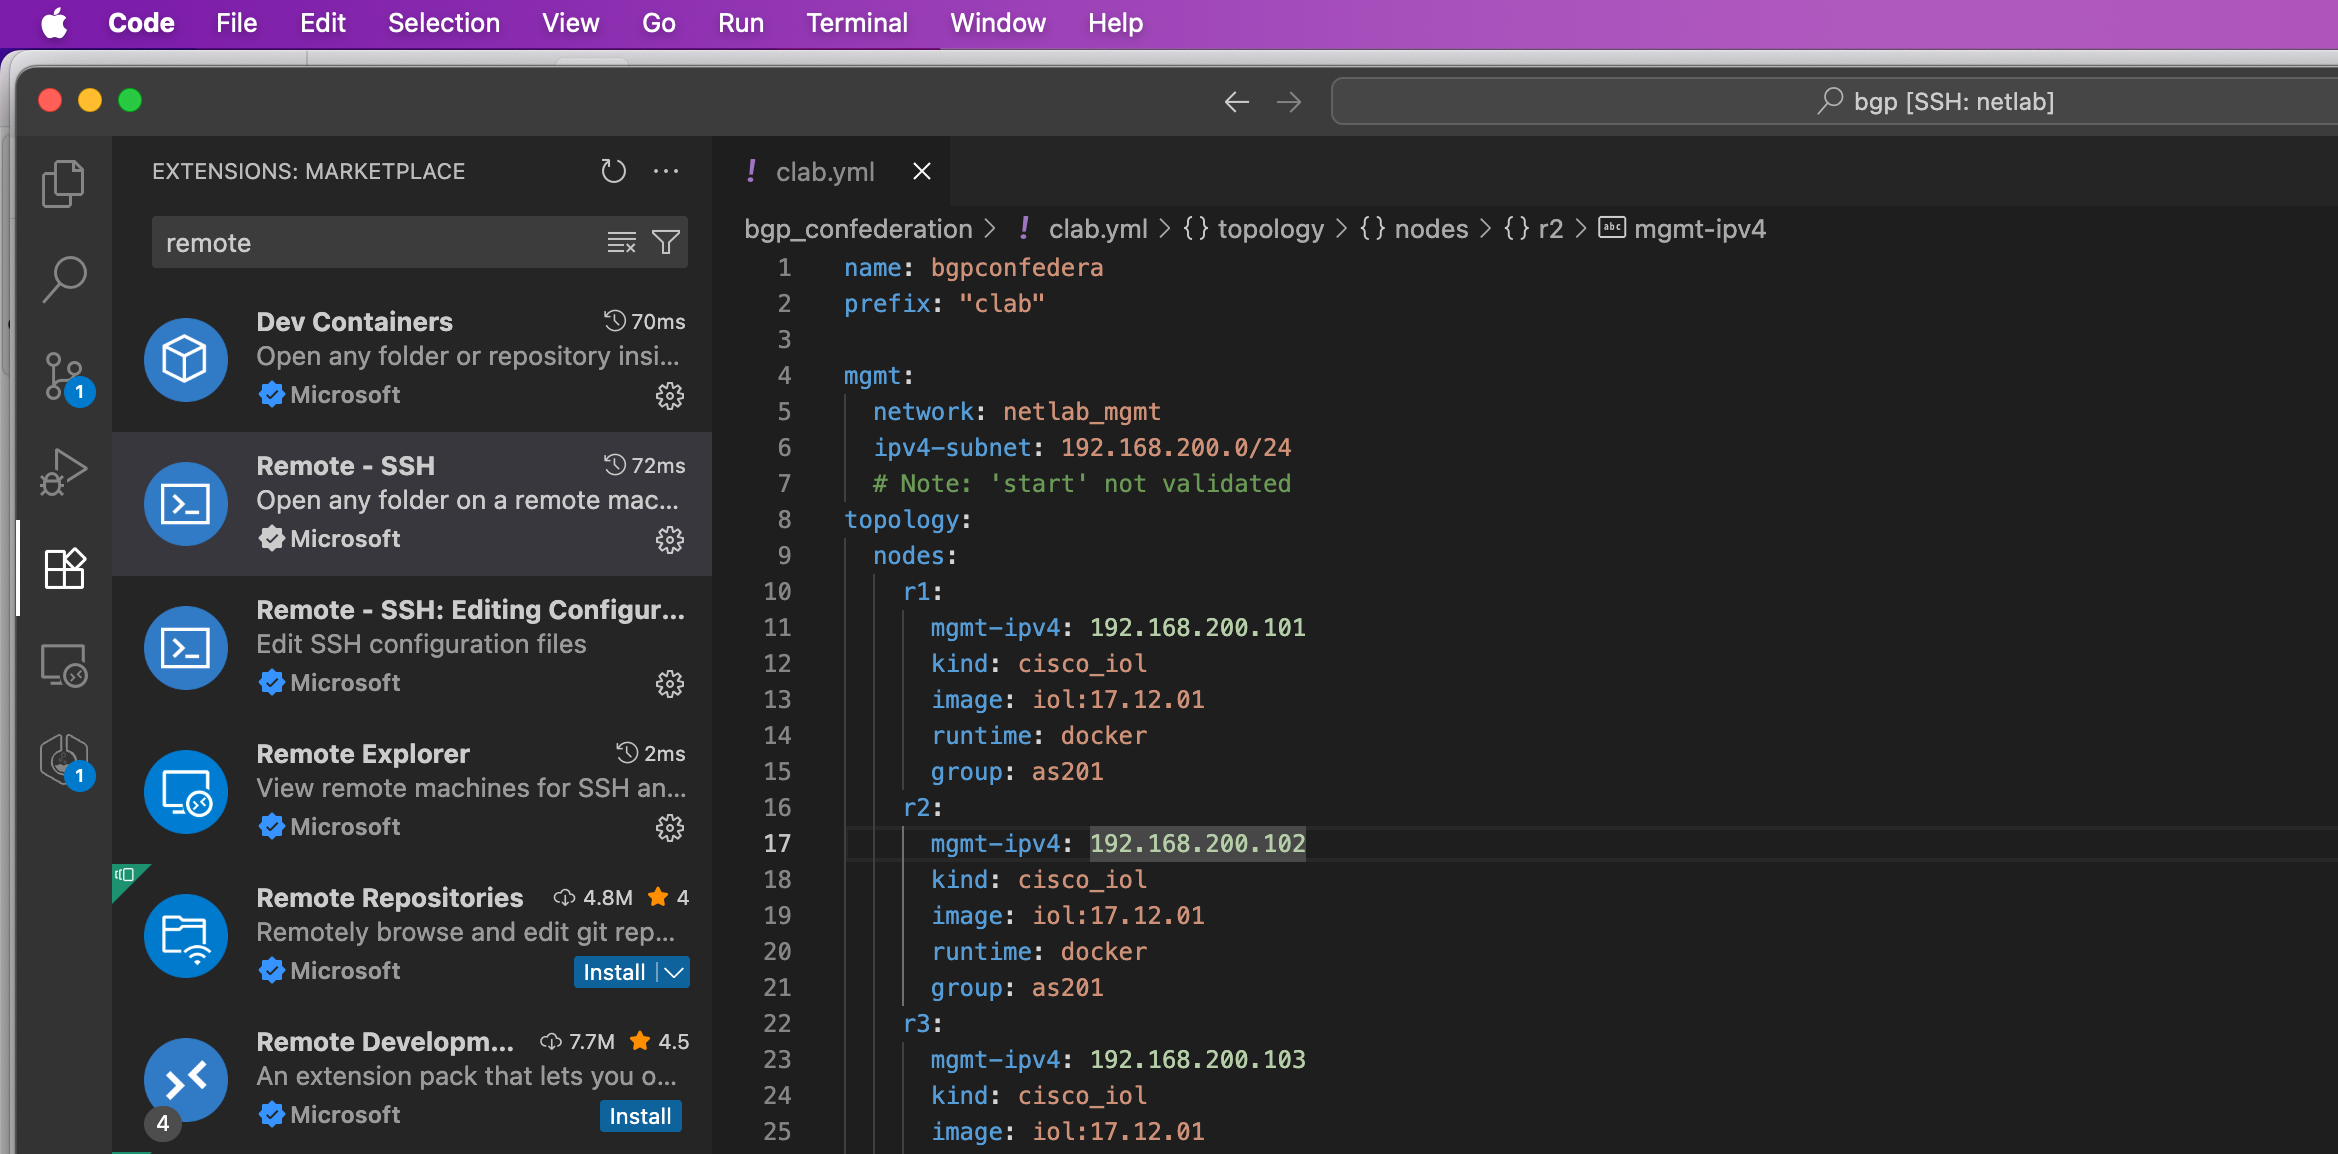
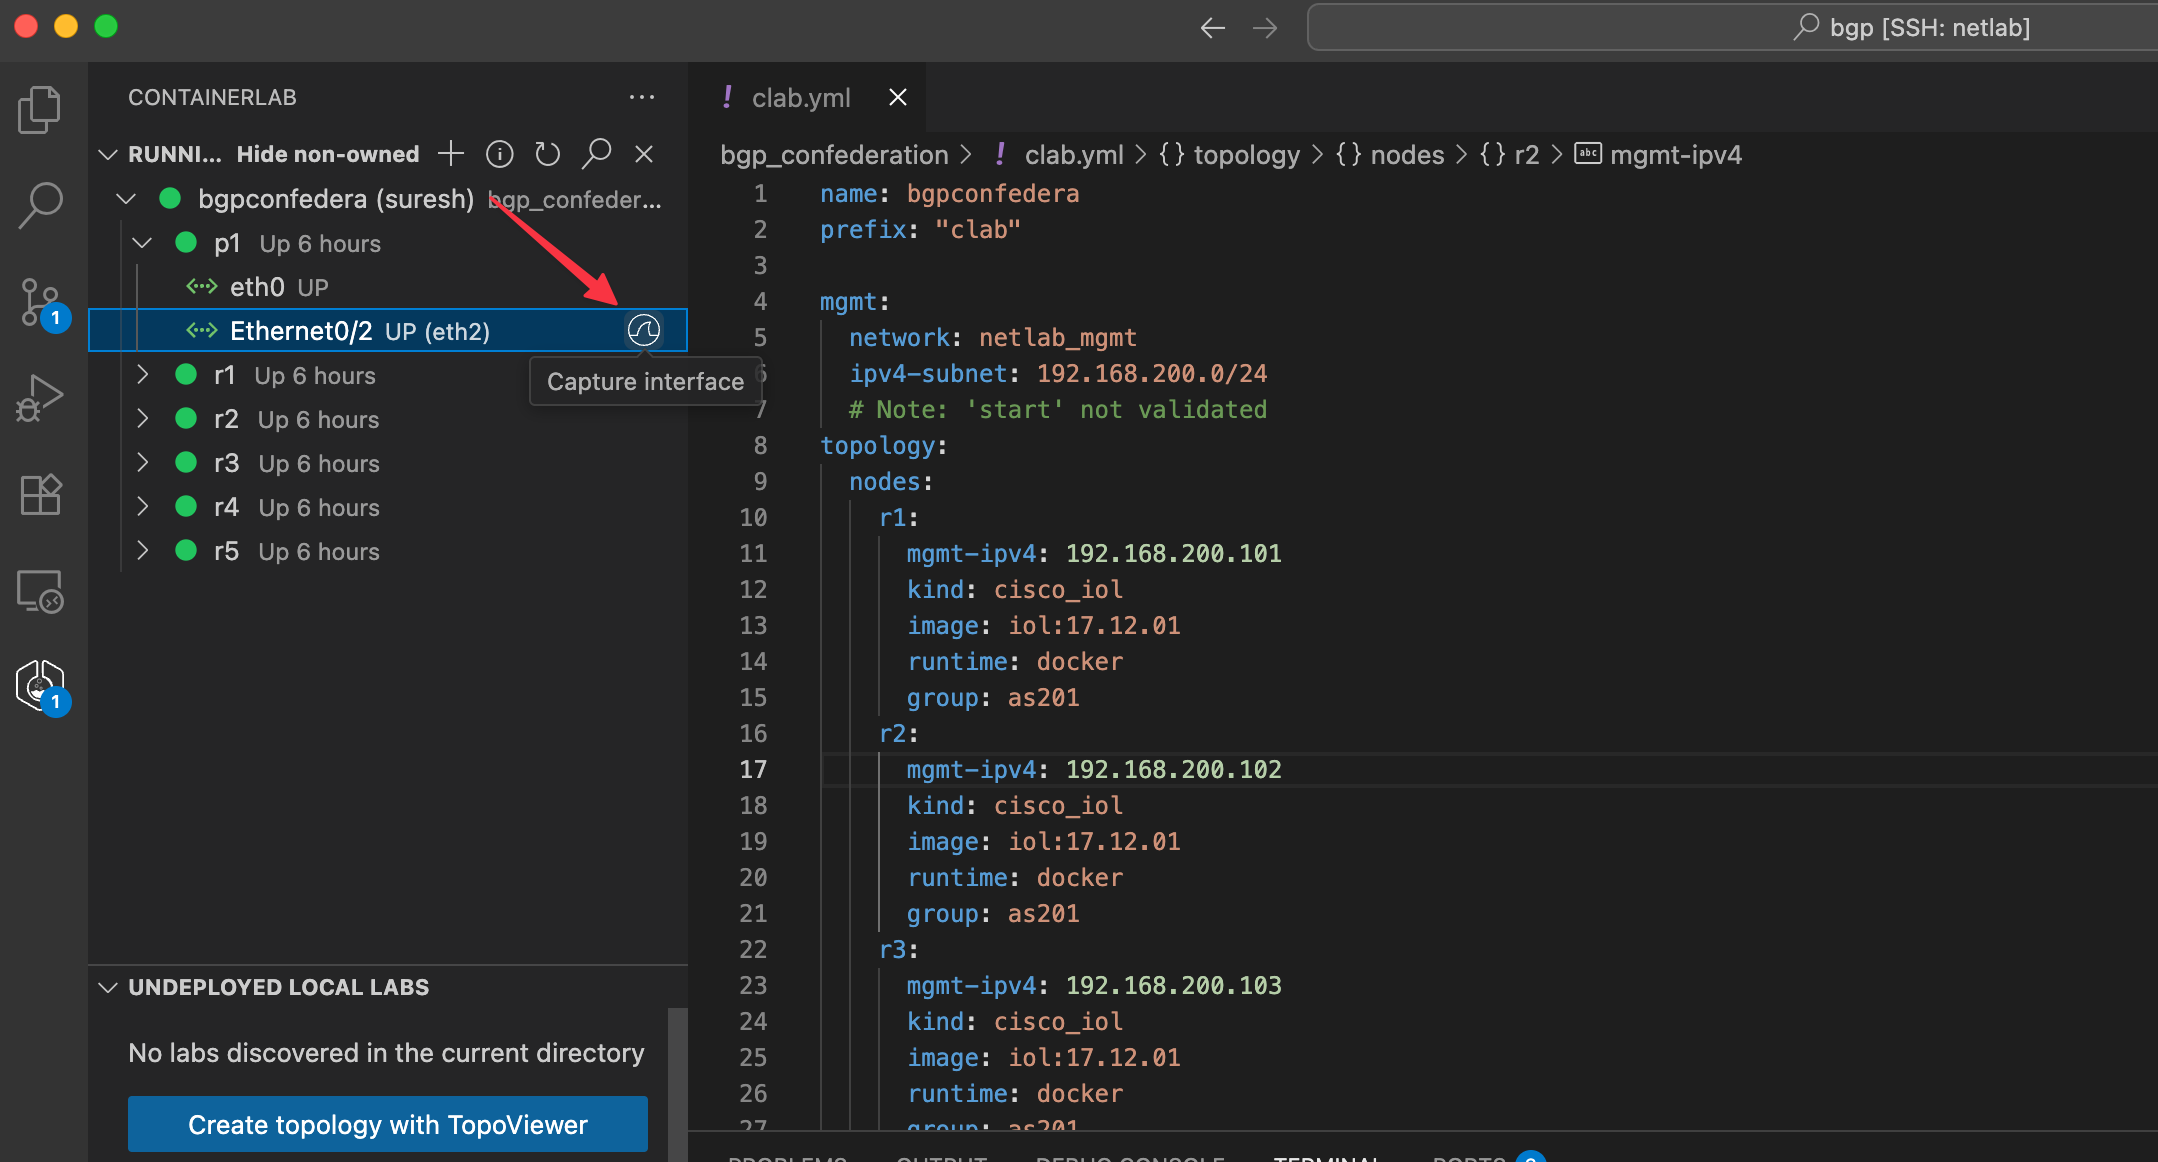
You can then install the Containerlab extension and open it, and it will automatically discover the clab.yml topology file. From there, you can easily browse the running nodes, pick the interface you want, and just click the 'fin' icon to start the capture.
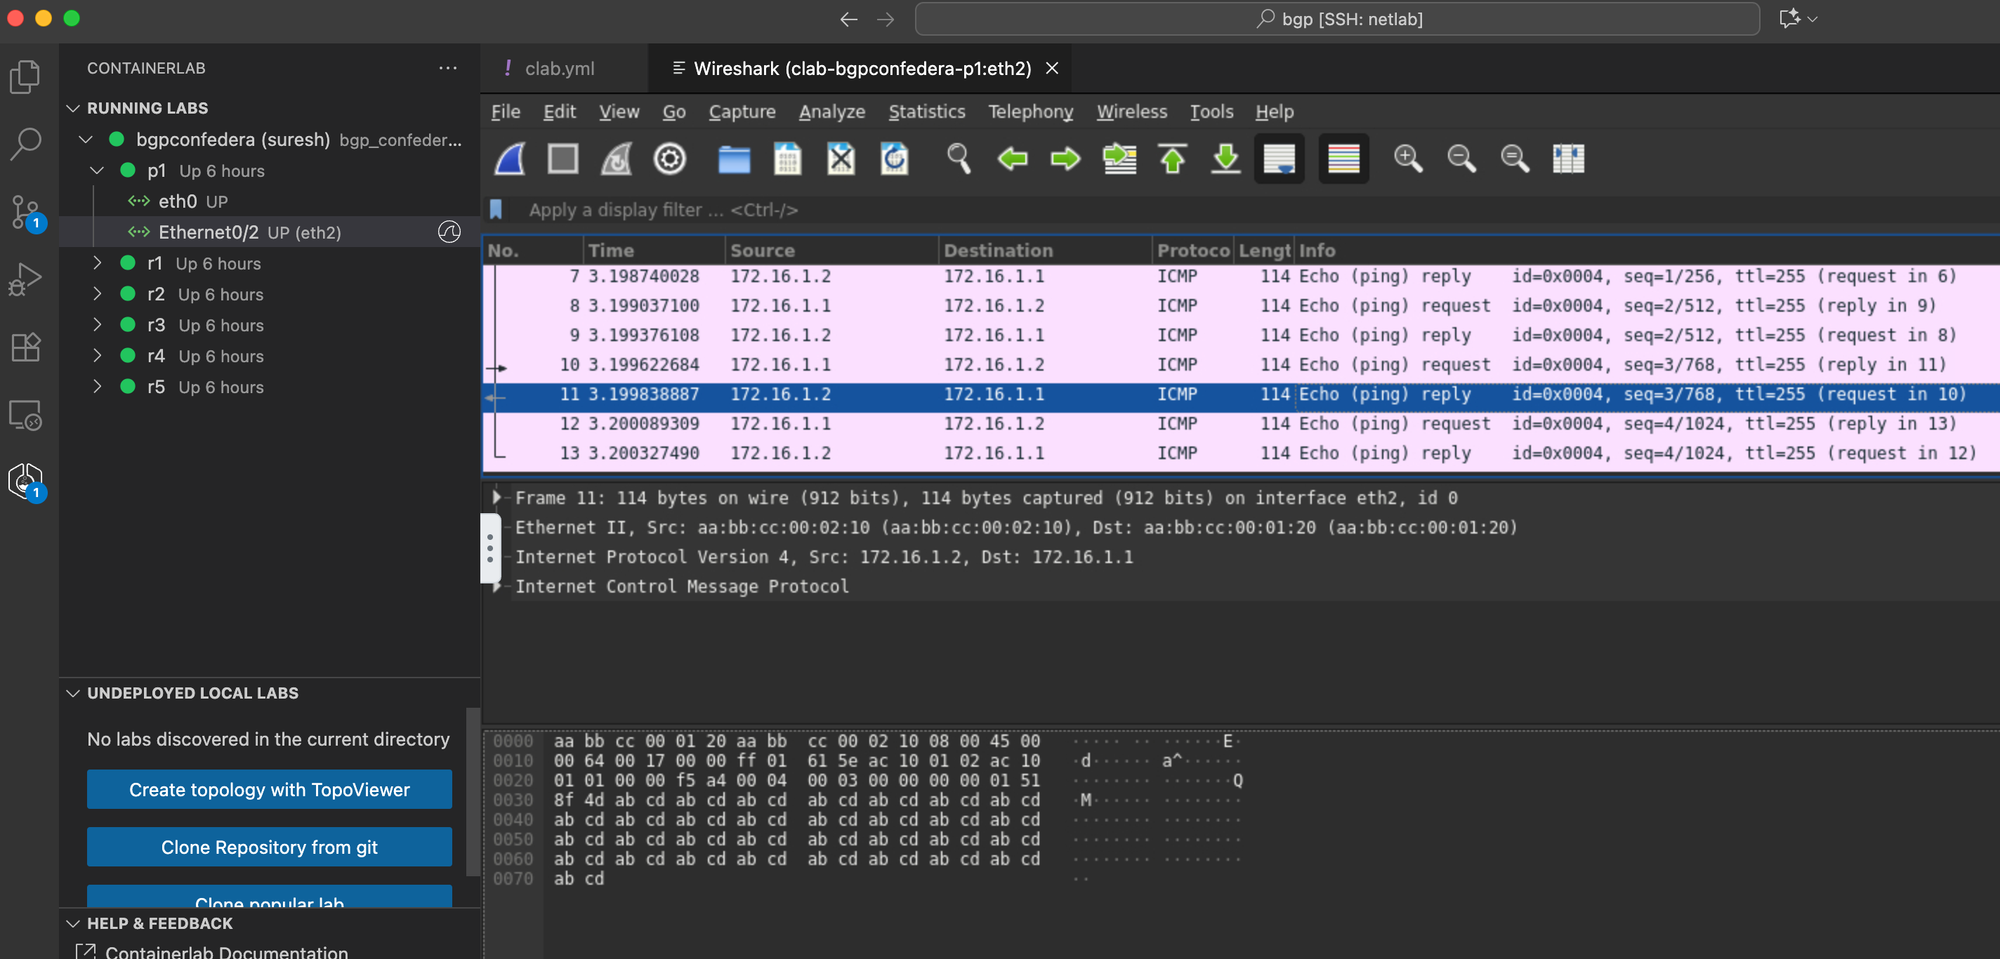
The Wireshark capture then opens directly inside VS Code, making it easy to analyze packets without leaving your editor. You also have the option to save the capture files directly on the VM that’s running Containerlab for later use.
You can also save the capture file by selecting File > Save As in Wireshark. Make sure to save it in the /pcaps directory, which keeps the capture in the same location as your clab.yml file.
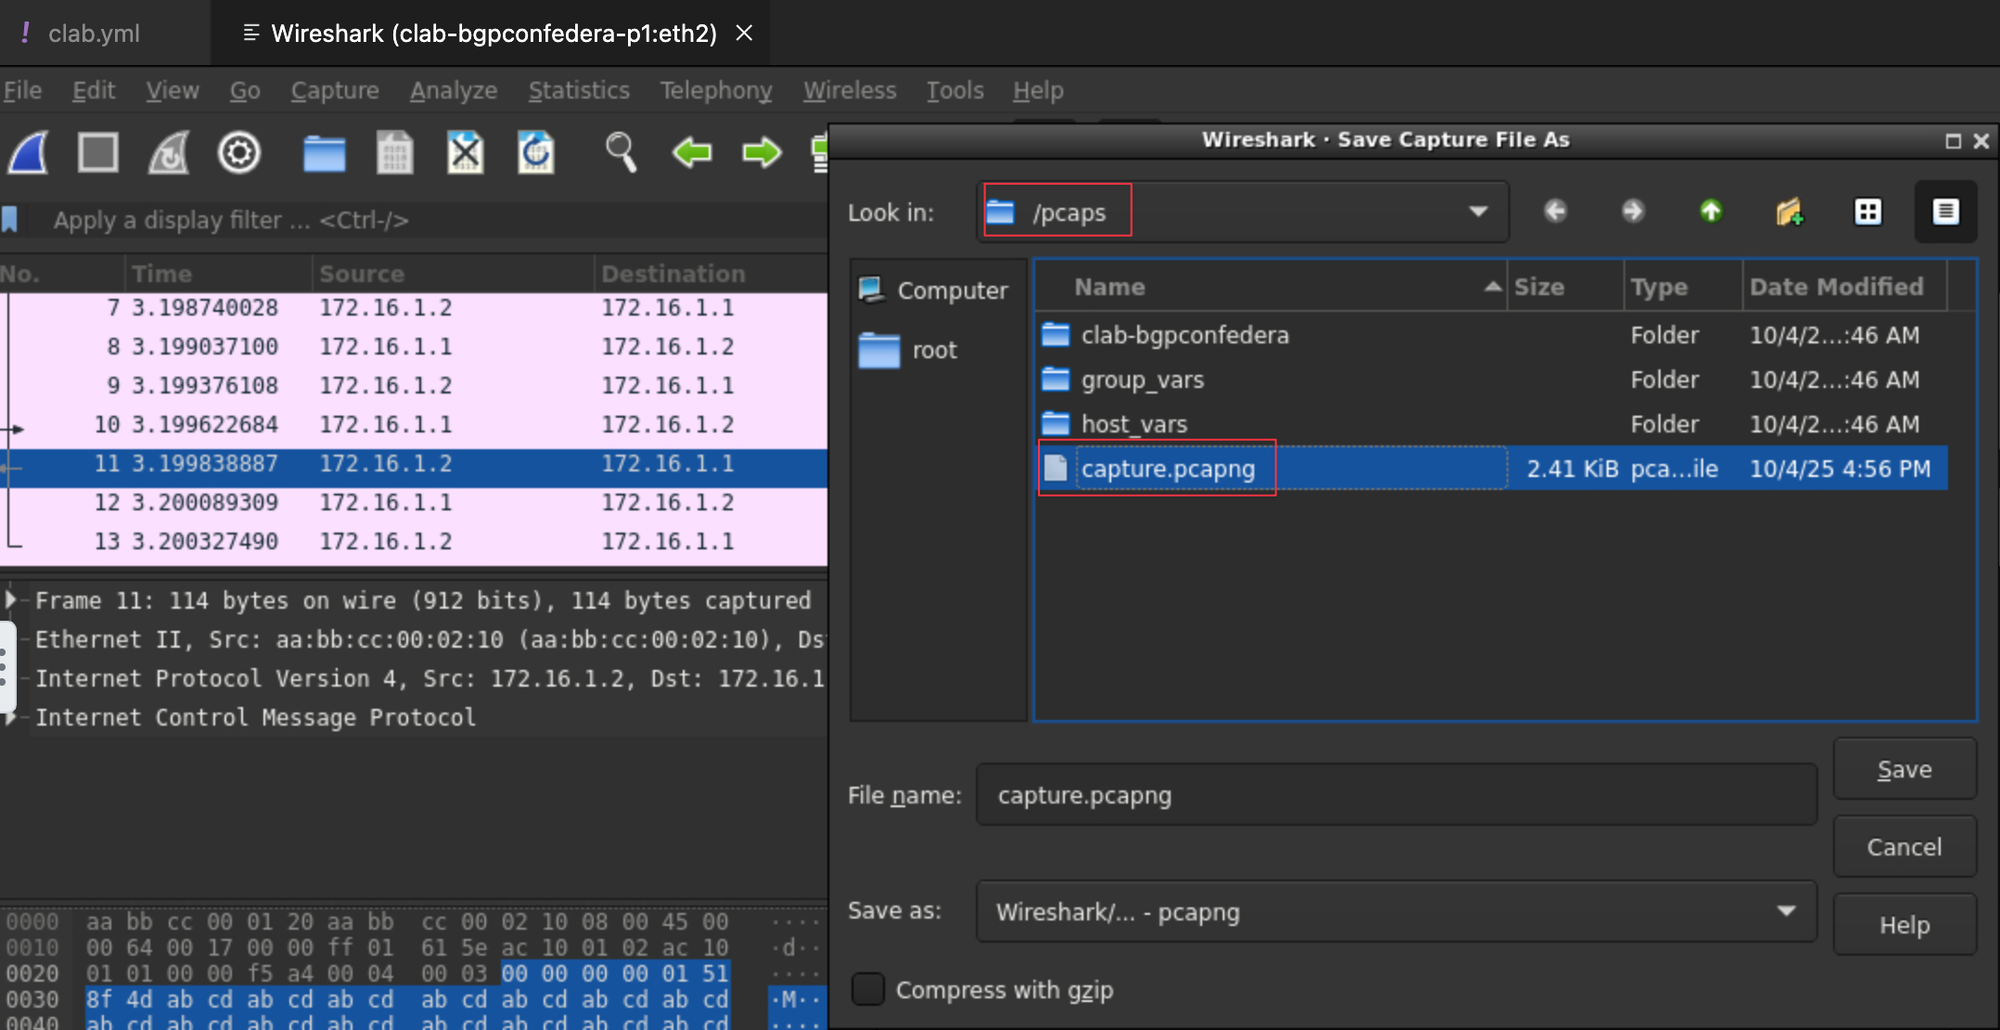
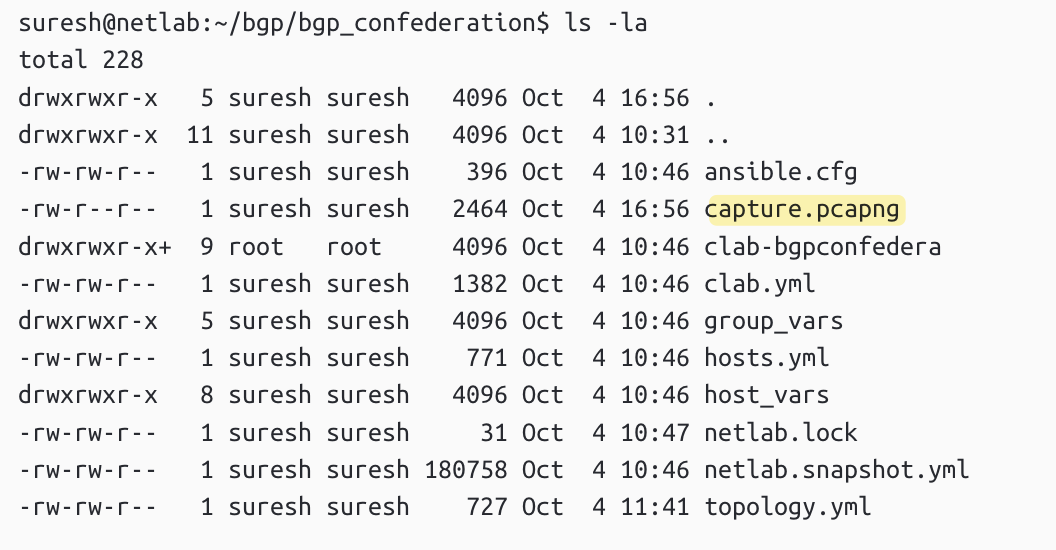
Once saved, you can use a simple scp command to copy the file to your local machine, in my case, my MacBook.
scp suresh@10.10.0.17:/home/suresh/bgp/bgp_confederation/capture.pcapng .References